Introduction
A/B testing transforms guesswork into data-driven decisions—and Webflow sites have unique advantages and considerations for running effective conversion experiments.
Most Webflow users build beautiful, fast-loading sites but leave conversion optimization on the table. The gap between a mediocre 2% conversion rate and optimized 5% conversion rate is often just a few strategic A/B tests—but you need the right tools and methodology to get there. Our guide on why you need conversion optimization for sales growth breaks down exactly how compounding conversion improvements translate into revenue over time.
The opportunity: Small improvements compound dramatically. A 25% increase in conversion rate doubles revenue over time at the same traffic cost. A/B testing is how you systematically discover these improvements rather than hoping intuition works.
The challenge: Webflow doesn't have native A/B testing built-in like some platforms. You need third-party tools and proper implementation to run tests—but the integration is straightforward once you understand the options.
This comprehensive guide covers everything you need to run effective A/B tests on Webflow sites—from tool selection and setup to what to test and best practices for statistical validity. Whether you're testing headlines, CTAs, layouts, or entire page designs, you'll learn the systematic approach that turns visitors into customers.
Expected outcomes: Proper A/B testing typically lifts conversion rates 10-30% within 3-6 months of systematic testing. The key is getting started, testing consistently, and learning from every experiment.
A/B Testing Tools for Webflow
Webflow integrates with several A/B testing platforms—choose based on budget, features, and technical requirements.
Google Optimize (Free, Integrated)
Best for: Beginners, small budgets, simple tests
Advantages:
- Free forever (basic version)
- Seamless Google Analytics integration (shares visitor data)—make sure your Webflow site is set up correctly first with our guide on how to set up Google Analytics on Webflow properly
- Visual editor for creating variations without code
- Easy setup (add tracking code to Webflow custom code)
- Multivariate testing (test multiple changes simultaneously)
Limitations:
- Basic reporting compared to paid tools
- Slower visual editor than competitors
- No server-side testing
- Google is sunsetting Optimize (September 2023)—look for replacement
Setup: Add Google Optimize snippet to Webflow Site Settings > Custom Code > Head
Optimizely
Best for: Enterprise, complex tests, high-traffic sites
Advantages:
- Robust experimentation platform (A/B, multivariate, personalization)
- Advanced targeting (audience segments, behavioral triggers)
- Statistical engine (built-in significance calculations)
- Server-side testing (no page flicker)
- Full-stack experimentation (web, mobile, apps)
Limitations:
- Expensive ($50,000+/year for enterprise plans)
- Steeper learning curve
- Overkill for small sites
Best fit: Sites with 50,000+ monthly visitors and conversion optimization budget
VWO (Visual Website Optimizer)
Best for: Mid-market, agencies, ecommerce
Advantages:
- All-in-one platform (A/B testing, heatmaps, session recordings, surveys)
- Visual editor (create variations without coding)
- Reasonable pricing (starts ~$200/month)
- Good support (responsive customer success team)
- Smart stats (Bayesian statistics for faster results)
Limitations:
- Performance impact (script can slow pages slightly)
- Visual editor sometimes struggles with complex Webflow layouts
Pricing: Plans from $200-600/month depending on traffic and features
Convert
Best for: Privacy-focused, GDPR compliance, mid-market
Advantages:
- Privacy-first (GDPR compliant, no data sharing)
- Fast performance (lightweight script, minimal impact)
- Lifetime A/B testing (data persists beyond trial periods)
- Excellent support (A/B testing guidance included)
Limitations:
- Less known than VWO or Optimizely
- Fewer integrations than competitors
Pricing: Similar to VWO (~$400-800/month)
Native Webflow Workarounds
For simple tests without third-party tools:
URL-based testing:
- Create two versions of page (e.g.,
/landing-page-a,/landing-page-b) - Split traffic manually via ad campaigns or random assignment
- Track conversions separately in Google Analytics
Limitations: No automatic traffic splitting, manual tracking, not suitable for most cases
When it works: Testing two completely different page designs with small traffic volumes
Tool Selection Criteria
Choose based on:
Budget:
- $0: Google Optimize (until sunset) or native workarounds
- $200-600/month: VWO or Convert
- $50,000+/year: Optimizely
Traffic volume:
- <10,000 visitors/month: Google Optimize or wait until traffic grows
- 10,000-50,000 visitors/month: VWO or Convert
- 50,000+ visitors/month: Optimizely or VWO
Technical complexity:
- Non-technical teams: VWO (visual editor, support)
- Technical teams: Any tool (can customize as needed)
- Enterprise needs: Optimizely (full-stack capabilities)
Feature requirements:
- Just A/B testing: Google Optimize or Convert
- Testing + heatmaps + recordings: VWO
- Advanced personalization: Optimizely
Recommendation: Start with VWO for most Webflow sites—good balance of features, ease of use, and pricing.
Setting Up A/B Tests in Webflow
Integration process is similar across tools—add tracking code, create variations, launch tests.
Integration Methods
Standard approach (all tools):
- Add tracking script to Webflow
- Site Settings > Custom Code
- Paste tool's tracking snippet in
<head>section - Publish site
- Install browser extension (VWO, Optimizely)
- Required for visual editor functionality
- Allows editing Webflow site in tool interface
- Connect domain
- Point tool to your Webflow site URL
- Tool loads your site in visual editor
Webflow-specific considerations:
- Add tracking code site-wide (not per-page) for consistent testing
- Place code high in
<head>to minimize flicker - Test both staging and production environments
Tracking Setup
Configure conversion goals:
Form submissions:
- Track form submit button clicks
- Or track thank-you page URL (if using redirect)
Button clicks:
- Track specific button element clicks
- Use unique IDs or classes for precise tracking
Revenue (ecommerce):
- Pass transaction value to tool
- Track Webflow Ecommerce checkout completions
Google Analytics integration:
- Connect A/B testing tool to GA
- View experiment data alongside analytics
- Segment test traffic in reports
- Set up conversion goals correctly—our guide to setting up conversion tracking in Google Analytics 4 covers the exact configuration steps
Verification:
- Submit test conversion
- Verify it registers in tool dashboard
- Check that variation assignment works
Creating Test Variations
Visual editor method (no code):
- Open visual editor in tool
- Browse to page you want to test
- Click element to change (headline, CTA, image)
- Edit content (text, color, position, visibility)
- Save variation
Changes you can make:
- Text content and copy
- Colors and styling
- Element positioning
- Show/hide elements
- Images and media
- Full page layout reorganization
Code-based method (advanced):
For complex changes not possible in visual editor:
- Add custom CSS or JavaScript in tool
- Manipulate Webflow Designer elements
- Implement dynamic content changes
Common Setup Issues
Page flicker (variation loads slowly):
- Reduce size of tracking script
- Use async loading
- Optimize Webflow page speed—our complete Webflow performance optimization guide covers every technique for reducing load time and eliminating render-blocking resources
- Consider server-side testing tools
Tracking doesn't work:
- Verify script in page source (view page source, search for tool name)
- Check browser console for errors
- Ensure no adblockers interfering
- Test in incognito mode
Visual editor can't load site:
- Check SSL certificate valid
- Verify domain accessible publicly
- Disable password protection temporarily
- Check Webflow hosting active
Conversions not tracking:
- Verify goal configuration matches actual page/event
- Test manually (trigger conversion, check dashboard)
- Check Google Analytics integration if used
What to Test on Webflow Sites
Prioritize high-impact elements that influence conversion decisions.
Headlines and Copy
Why test: Headlines determine whether visitors engage or bounce
What to test:
- Value proposition clarity ("Save 10 hours/week" vs. "Productivity tool")
- Length (short punchy vs. detailed explanatory)
- Tone (professional vs. casual, urgent vs. informational)
- Specificity ("Trusted by 50,000 companies" vs. "Trusted by thousands")
Example hypothesis: "Specific benefit-focused headline will convert 15% better than feature-focused headline"
CTAs and Buttons
Why test: CTA is the conversion moment—small changes have big impact
What to test:
- Button text ("Start Free Trial" vs. "Get Started" vs. "Try It Free")
- Color (contrasting vs. brand-matching)
- Size (larger more visible vs. understated)
- Position (above fold vs. after social proof)—our guide on how to optimize your sales funnel with Webflow covers exactly how CTA placement interacts with the broader funnel design
- Number of CTAs (one primary vs. multiple options)
High-impact test: CTA text often lifts conversions 10-30% with right wording
Page Layouts and Design
Why test: Layout determines how visitors process information
What to test:
- Hero section (full-width image vs. split with copy)
- Navigation (visible vs. minimal vs. hidden)
- Content order (features-first vs. benefits-first vs. social-proof-first)
- White space (minimal vs. generous padding)
- Column layouts (single vs. two-column vs. three-column)
Caution: Layout tests require more traffic (bigger changes = more variation in results)
Forms and Friction Points
Why test: Every form field is friction—optimize ruthlessly
What to test:
- Number of fields (3 fields vs. 5 fields vs. 7 fields)
- Field types (single name field vs. separate first/last)
- Optional vs. required (mark optional or remove entirely)
- Multi-step vs. single-step (break long forms into steps)
- Trust signals (privacy text below form vs. none)
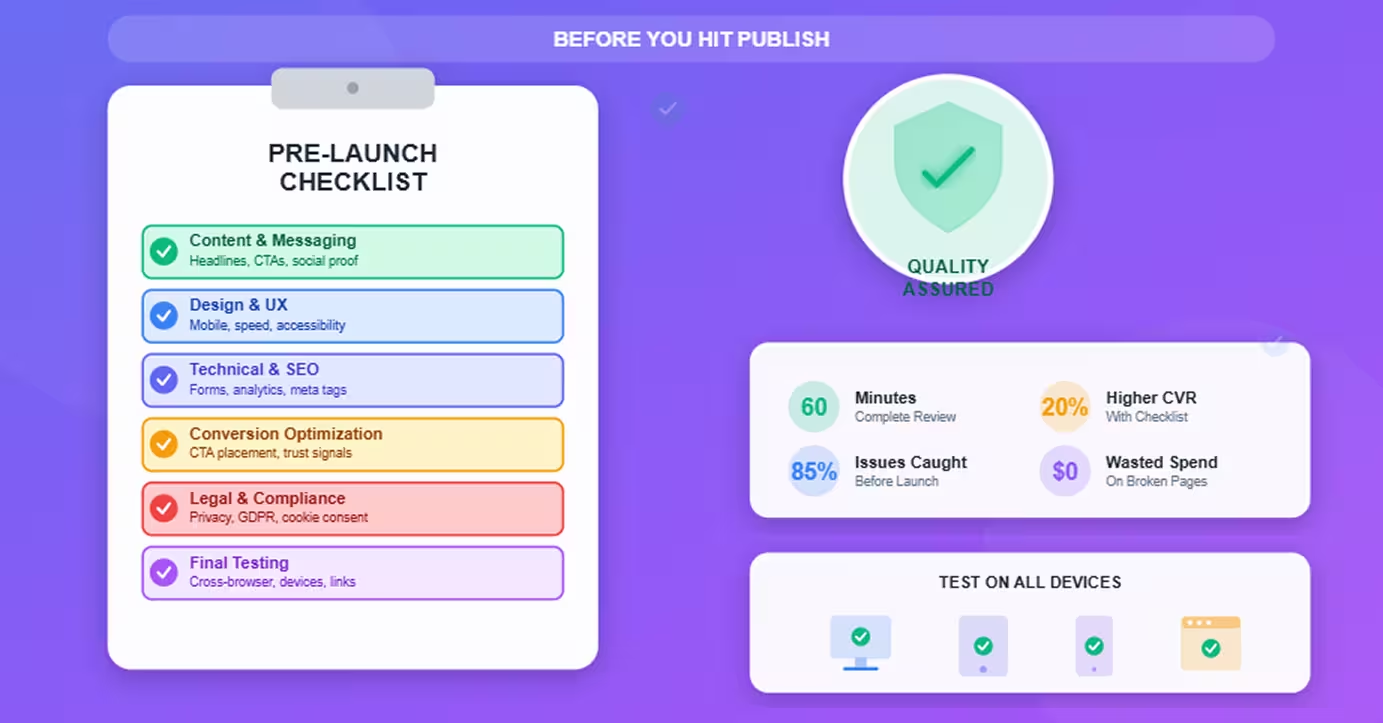
Benchmark: Each additional field reduces conversions ~5-10%—our landing page checklist covers the full pre-launch form optimization checklist before you start testing.
Prioritization Framework
Test in order of potential impact:
High impact (test first):
- Headlines (determines engagement)
- CTA text and color (conversion moment)
- Form length (immediate friction reduction)
- Social proof placement (trust signal timing)
Medium impact (test after high-impact wins):5. Page layout (influences information processing)6. Images and media (emotional connection)7. Copy length and structure (engagement depth)
Low impact (test last or skip):8. Footer design (low attention area)9. Font choices (minimal impact unless currently poor)10. Minor color variations (marginal gains)
Principle: Focus testing where most visitors make conversion decisions
A/B Testing Best Practices
Follow rigorous methodology to get reliable results.
Statistical Significance
Don't trust results until statistically valid.
95% confidence level: Industry standard
- Means 95% probability difference is real, not random chance
- Or 5% risk result is false positive
How tools show this:
- "Statistically significant" indicator
- Confidence percentage
- P-value (should be <0.05)
Never call winner prematurely: Declaring winner at 70% confidence leads to false conclusions and bad decisions
Sample Size Requirements
Need sufficient visitors in each variation.
Minimum sample sizes (rough guidelines):
For detecting 10% lift:
- Need ~10,000 visitors per variation
- At 2% baseline conversion, need ~500 conversions
For detecting 20% lift:
- Need ~2,500 visitors per variation
- At 2% baseline conversion, need ~125 conversions
For detecting 50% lift:
- Need ~400 visitors per variation
- At 2% baseline conversion, need ~20 conversions
Use sample size calculators: Most tools include calculators; also available online
Smaller sites: Test bigger changes (easier to detect) or accept longer test durations
Test Duration
Run tests long enough to account for variation.
Minimum: 1 week
- Captures weekday vs. weekend behavior differences
- Accounts for day-of-week effects
Recommended: 2-4 weeks
- Captures multiple business cycles
- Sufficient for statistical significance at moderate traffic
Maximum: 6-8 weeks
- Longer tests risk external factors (seasonality, competitors, market changes)
- If not significant after 8 weeks, likely no meaningful difference
Traffic-dependent: High-traffic sites reach significance faster; low-traffic sites need longer duration
One Variable at a Time
Test single changes for clear learning.
Good test: Change headline only
- Clear what caused conversion change
- Learnings applicable to future tests
Bad test: Change headline + CTA + layout simultaneously
- Can't isolate which change drove results
- Winner might succeed despite one bad change
Exception: Multivariate testing
- Advanced technique testing multiple variables
- Requires much more traffic (10× or more)
- Most sites should stick to single-variable A/B tests
Documentation and Learning
Build organizational testing knowledge.
Document every test:
- Hypothesis (what you're testing and why)
- Variations (exact changes made)
- Results (conversion rates, statistical significance)
- Learnings (why it worked or didn't)
- Next tests (what to test based on results)
Build testing library: Repository of all tests with outcomes—prevents repeating tests and informs future experiments
Share learnings: Circulate results to team—builds testing culture and improves hypothesis quality
Common Mistakes to Avoid
Pitfalls that invalidate results or waste time.
Testing Too Many Variables
The mistake: Changing headline, CTA, layout, and images simultaneously
Why it's bad: Can't determine what drove results
Fix: Test one change at a time; build winning page incrementally
Stopping Tests Too Early
The mistake: Calling winner after 3 days because variation is ahead
Why it's bad: Early results fluctuate; premature conclusion often wrong
Fix: Wait for statistical significance + minimum duration (1-2 weeks)
Ignoring Mobile Differences
The mistake: Testing only desktop experience
Why it's bad: 60%+ of traffic is mobile; mobile behavior differs
Fix: Review variations on mobile; consider separate mobile tests
Not Having Clear Hypotheses
The mistake: "Let's test a red button vs. blue button"
Why it's bad: No learning if results are inconclusive; doesn't inform future tests
Fix: Form hypothesis: "Red button will convert better because it contrasts more with page design and draws attention"
Poor Tracking Implementation
The mistake: Goals misconfigured or tracking breaks
Why it's bad: Wasted traffic and time; unreliable results
Fix: Thoroughly test tracking before launching test; verify conversions register correctly
Conclusion
A/B testing transforms Webflow sites from beautiful to high-converting—and the tools and methodology are accessible to any site owner willing to test systematically.
The framework:
- Choose tool: VWO for most sites (balance of features and price)
- Set up properly: Add tracking code, configure goals, verify functionality
- Prioritize tests: Start with headlines and CTAs (highest impact)
- Follow best practices: Statistical significance, adequate duration, one variable at a time
- Document learnings: Build knowledge base for continuous improvement
The reality: Most Webflow sites never A/B test—leaving easy conversion gains untouched. Sites that test systematically (2-4 tests per month) typically see 20-30% conversion lifts over 6-12 months. Pairing this with strong site structure built for lead generation ensures every winning variation feeds into a funnel that's already primed to convert.
Getting started:
- Week 1: Set up tool (VWO recommended)
- Week 2: Run first test (headline or CTA)
- Week 4: Analyze results, launch second test
- Month 2-3: Test monthly, build testing habit
- Month 6: Measure cumulative conversion improvement
The competitive advantage: While others guess at optimization, you have data. That data compounds into significant traffic-to-customer advantages over time.
Start testing today—your first experiment teaches more than months of guesswork.
Frequently Asked Questions
What's the minimum traffic needed to run A/B tests on Webflow?
Realistic minimum: 1,000 visitors/month to test area; ideal: 5,000+ visitors/month.
Why traffic matters:
- Statistical significance requires sufficient sample size
- Fewer visitors = longer test duration for reliable results
- Too little traffic makes detecting improvements impossible
Traffic-based guidelines:
Under 1,000 visitors/month:
- A/B testing not recommended yet
- Focus on driving more traffic first (SEO, ads, content)—our guide on how to develop an SEO content strategy in Webflow is the ideal starting point for building the organic traffic base A/B testing requires
- Once traffic grows, start testing
1,000-5,000 visitors/month:
- Can test big changes (25%+ expected lift)
- Examples: Completely different headlines, major CTA changes, page redesigns
- Expect 4-8 week test durations
- Run 1-2 tests per quarter
5,000-20,000 visitors/month:
- Can test moderate changes (15-25% expected lift)
- Examples: CTA text variations, form length, layout changes
- Expect 2-4 week test durations
- Run 1-2 tests per month
20,000+ visitors/month:
- Can test incremental changes (10-15% expected lift)
- Examples: Button colors, headline variations, image choices
- Expect 1-2 week test durations
- Run 2-4 tests per month
Sample size calculation:
For 2% baseline conversion rate, detecting 20% lift (to 2.4%):
- Need ~3,000 visitors per variation
- At 5,000 visitors/month = 3-month test duration
- At 20,000 visitors/month = 2-week test duration
What if traffic is too low?
Alternative approaches:
- Qualitative research: User surveys, session recordings (Hotjar), user interviews
- Heuristic analysis: Expert review against best practices
- Full funnel tracking: Set up proper event tracking with lead funnels on Webflow using GTM and GA4 to understand where users drop off before you start testing
- Focus on traffic growth: SEO and content marketing increase testable traffic over time
Bottom line: You can test with 1,000+ visitors/month if testing major changes and accepting longer durations. Under 1,000/month, better to focus on growing traffic before optimizing conversion.
Can I test entire page redesigns in Webflow or just small elements?
Yes—you can test entire page redesigns, and sometimes should.
How to test full page redesigns:
Method 1: Duplicate page in Webflow
- Create new page in Webflow (e.g.,
/landing-page-test) - Design completely different version
- Split traffic 50/50 between original and test page
- Track conversions separately
Pros: Full design flexibility; no tool limitationsCons: Manual traffic splitting; more complex tracking
Method 2: Visual editor + code (A/B tool)
- Use VWO or Optimizely visual editor
- Make major changes (layout, hero, sections)
- Add custom CSS/JS for deeper changes
- Tool automatically splits traffic and tracks
Pros: Automatic traffic splitting; integrated trackingCons: Visual editor can struggle with complex Webflow layouts
Method 3: Webflow CMS-driven variants
- Use Webflow CMS conditional visibility
- Create single page with two layout versions
- Show different version based on URL parameter
- Traffic split via ads or link variations
Pros: Fully native to WebflowCons: Manual traffic management; limited to CMS sites
When to test full redesigns vs. elements:
Test full redesigns when:
- Current page fundamentally underperforming
- Major strategy shift (e.g., B2B to B2C positioning)
- Sufficient traffic (20,000+ visitors/month)
- Strong hypothesis for why redesign will work
Test individual elements when:
- Page performing moderately well; seeking optimization
- Lower traffic (harder to detect small differences)
- Building incremental improvements
- Learning what works for future pages
Best practice:
- Start with element tests (headlines, CTAs, forms)
- After 5-10 element tests, test section redesigns (hero, pricing section)
- After learning what works, test full page redesigns incorporating winners
Caution: Full redesigns require larger sample sizes (harder to detect differences); make sure traffic supports test duration.
How do I know which variation won if results are close?
Statistical significance determines winner—not which variation is ahead by percentage points.
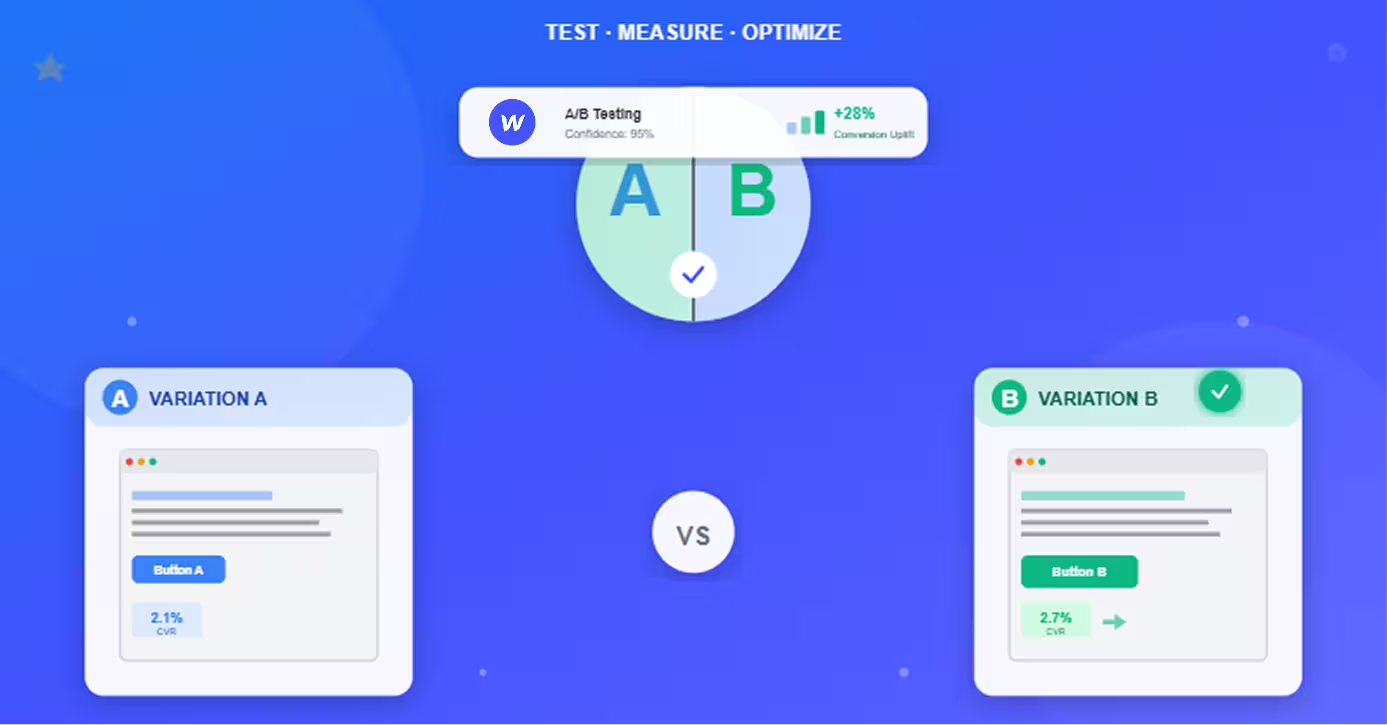
The scenario:
- Variation A: 2.1% conversion rate
- Variation B: 2.3% conversion rate
- Variation B is ahead, but is it a real difference?
Check statistical significance:
Look for confidence level in tool:
- 95%+ confidence: Clear winner (B beats A)
- 90-94% confidence: Likely winner, but marginal
- <90% confidence: No clear winner; difference could be random
P-value indicator:
- P < 0.05: Statistically significant (clear winner)
- P > 0.05: Not significant (no clear winner)
If results are close but not significant:
Option 1: Run longer (preferred)
- Continue test for more visitors
- Significance may emerge with more data
- Check weekly until significance reached or max duration (8 weeks) hit
Option 2: Accept inconclusive
- If 8 weeks passed and still not significant, likely no meaningful difference
- Keep original (no reason to change if improvement unproven)
- Document as inconclusive; test something else
Option 3: Implement winning pattern (with caution)
- If trend consistent but not quite significant (85-90% confidence)
- Consider implementing if uplift meaningful and risk acceptable
- Document as "directional win" not "proven"
Never:
- Call winner based on percentage alone
- Stop test early because variation is ahead
- Flip-flop between declaring winners
Example of getting it wrong:
Day 3 results:
- Variation A: 3.1% (ahead!)
- Variation B: 2.8%
Day 14 results (final, significant):
- Variation A: 2.0%
- Variation B: 2.4% (winner)
Early lead reversed—this is common. Trust statistics, not intuition or early trends.
What should I test first if I'm new to A/B testing?
Test headline or CTA first—highest impact, easiest to execute, fastest learning.
Recommended first test: Primary CTA button text
Why CTA text first:
- High impact: CTA is conversion moment; text changes can lift 10-30%
- Easy to implement: Simple text change in visual editor
- Fast results: Small change easier to detect; reaches significance quicker
- Clear learning: Direct insight into what motivates your audience
First test setup:
Control: Current CTA ("Get Started")Variation: Benefit-focused CTA ("Start My Free Trial")
Hypothesis: "Benefit-focused CTA emphasizing 'free' will convert better because it reduces perceived risk and highlights value"
Expected lift: 10-20%
Duration: 2-3 weeks (depending on traffic)
Alternative first tests (if CTA already optimized):
Second choice: Headline
- Control: Current headline
- Variation: More specific, benefit-focused headline
- Expected lift: 15-25%
Third choice: Form length
- Control: Current form (e.g., 5 fields)
- Variation: Shorter form (e.g., 3 fields)
- Expected lift: 20-40% (each field costs ~5-10% conversions)
Tests to avoid as first test:
Don't start with:
- Full page redesigns (too complex, hard to learn from)
- Subtle color changes (unlikely to detect difference with limited experience)
- Multiple simultaneous changes (can't isolate what worked)
- Footer or low-attention areas (low impact)
First 3-month testing roadmap:
Month 1: Test CTA text
- Week 1: Set up tool, create first test
- Week 2-4: Run test, analyze results
- Week 4: Document learnings, decide next test
Month 2: Test headline or form length
- Week 5: Implement first winner, launch second test
- Week 6-9: Run test, analyze results
Month 3: Test layout or social proof placement
- Week 10: Implement second winner, launch third test
- Week 11-13: Run test, analyze results
By month 3: Built testing habit, proven impact, ready for more advanced tests
Quick win focus: First 2-3 tests should be "easy wins"—high-impact changes likely to succeed. Builds confidence and proves ROI of testing program. For a broader framework connecting A/B testing to your overall conversion goals, see our guide on why landing page optimization matters and how it fits into your growth strategy.